.svg)

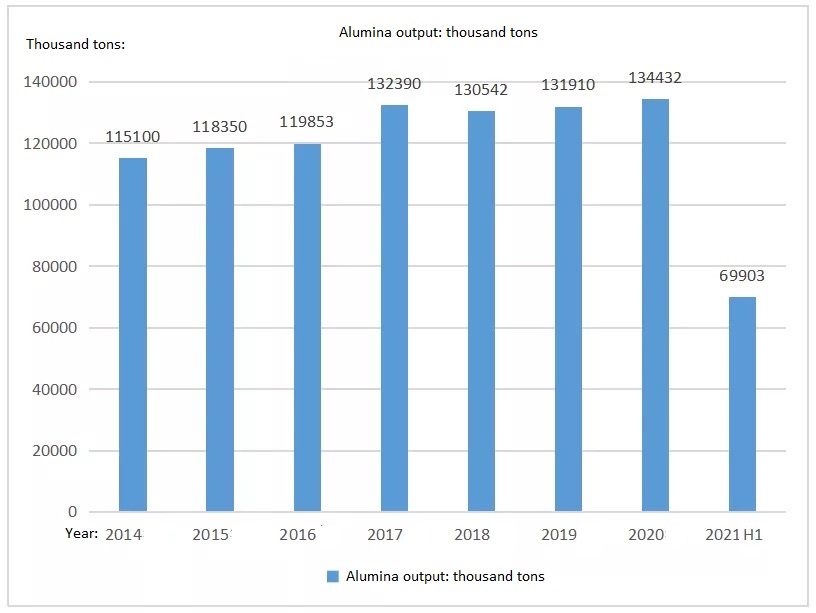
In recent years, global alumina production has grown rapidly. In 2020, global alumina production reached 134,432 kilotons, an increase of 2,522 kilotons from 2019, a year-on-year increase of 1.9%.
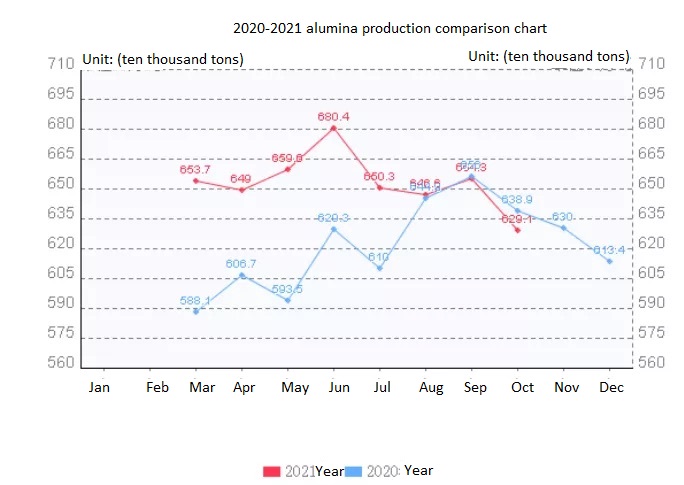
The monthly global alumina production in the first half of 2021 was significantly higher than that in the same period in 2020. The global alumina market has fully recovered. In June 2021, the global alumina production was 11,695 kilotons, an increase of 705 kilotons over the same period in 2020.
Below is the statistics chart of global alumina production from 2014 to the first half of 2021:
With the continuous improvement of alumina production technologies in various countries, the global average daily output of alumina has increased significantly. In 2020, the global average daily output of alumina reached 367 kilotons/day, an increase of 5.9 kilotons/day from 2019, an increase of 1.6% year-on-year In the first half of 2021, the global daily average output of alumina was 386.2 kilotons per day.
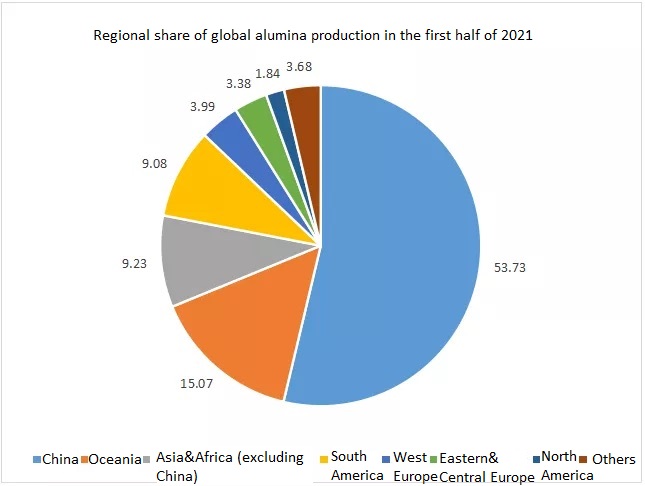
In the first half of 2021, China’s alumina production accounted for 53.73% of the global total alumina production, a very large proportion; Oceania’s alumina production accounted for 15.07% of the global alumina production; Africa and Asia (excluding China) accounted for the global alumina production 9.23% of the total alumina production; South America’s alumina production accounted for 9.08% of the global alumina production; Western Europe’s alumina production accounted for 3.99% of the global alumina production; Eastern and Central Europe’s alumina production accounted for the world’s total alumina production 3.38%; North American alumina production accounts for 1.84% of global alumina production.
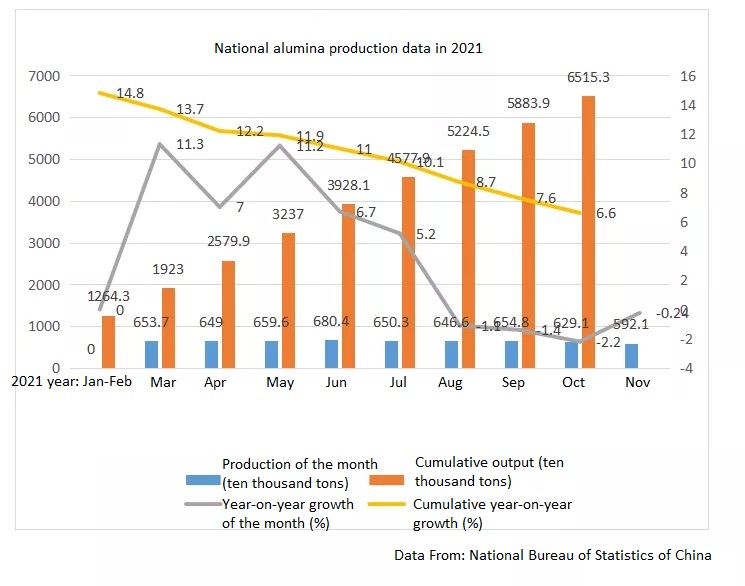
The data learned from the National Bureau of Statistics of China show that from January to October 2021, the cumulative data of national alumina production reached 65.153 million tons. The output in a single month in November was 5.921 million tons. Below picture is the output of alumina from January to October 2021.
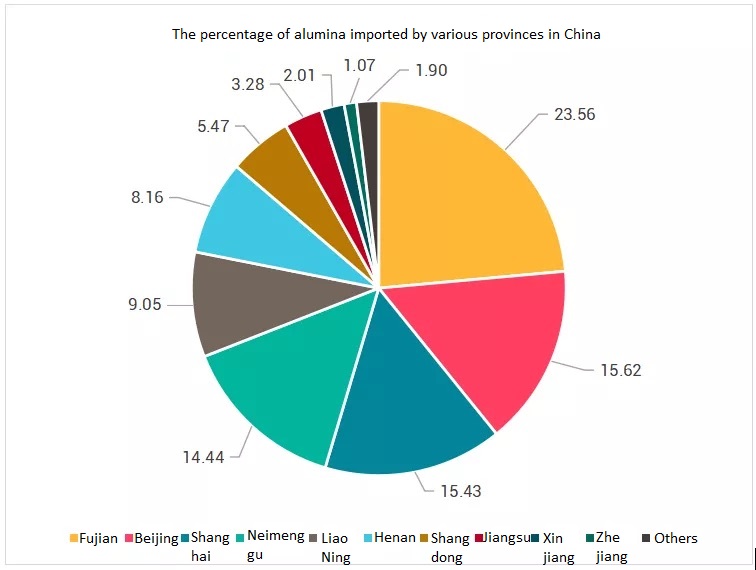
China’s alumina imports are mainly distributed in Fujian, Shanghai, Beijing, Inner Mongolia, Liaoning, Shandong, Henan, Jiangsu, Xinjiang, Zhejiang, Chongqing, and other places. Among them, Fujian, Shanghai, and Beijing continue to rank among the top three import provinces in alumina imports, and Fujian’s alumina imports accounted for 23.56%.
(Data From: National Bureau of Statistics of China, Customs Net, etc.)
Declaration: This is an original article of INNOVACERA®. Please indicate the source link when reprinting: https://www.innovacera.com/news/whats-alumina-production-in-2021.html.


 Enquiry